When Should You Visit? — The Months Japanese People Secretly Hope You'll Come
What you'll learn in this article:
- How 42.7 million visitors distributed across 12 months in 2025 — and why 70% chose the same 6 months
- What 286 Japanese people said about tourist timing — from Kyoto residents to rural inn owners to exhausted service workers
- Why shifting your trip by just one month can transform your experience — and earn you a warmer welcome
When is the best time to visit Japan? Based on 42.7 million visitor arrivals in 2025 and 286 Japanese voices, February and November offer the ideal mix of good weather, low crowds, and genuine local welcome. Kyoto hotel occupancy drops to 52.6% in January, and 75% of the Japanese people we asked said they actively appreciate off-peak visitors. Shifting your trip by just one month can transform the entire experience.
3.9 million vs. 3.3 million. That's the gap between Japan's busiest month (April) and its quietest (February) in 2025. The difference? A completely different Japan.
Every travel guide tells you the same thing: spring for cherry blossoms, autumn for foliage. And they're not wrong — those seasons are stunning. But here's what no guidebook shows you: the month you choose doesn't just affect what you see. It affects how Japan sees you.
We took three layers of government data — monthly visitor statistics from JNTO, accommodation occupancy from the Japan Tourism Agency, and 30-year climate normals from the Japan Meteorological Agency — and overlaid them with 286 real opinions from Japanese people to answer a question no one else has asked: when do Japanese people actually want you to come?
The numbers show you when it's crowded. The voices tell you when you're most welcome. The overlap reveals the real best time to visit.
Quick Guide
| What the Numbers Say | What Japanese People Say | |
|---|---|---|
| 🟢 The sweet spots | February and November have the fewest crowds with pleasant weather (cold but clear in Feb; perfect autumn in Nov). Kyoto drops to 52.6% hotel occupancy in January. | "むかし暮らしていた頃のような穏やかな空気感" — "It felt like the calm Kyoto I used to live in." Off-peak visitors are genuinely appreciated. |
| 🟡 The trade-off months | April and October have the best weather AND the biggest crowds. 3.9 million visitors in April alone. Osaka hits 85% hotel occupancy in October. | "京都には観光シーズンなんてないわな" — "There's no such thing as a tourist season in Kyoto anymore." Locals are tired of year-round peak. |
| 🔴 The honest warning | June–September brings rain, humidity, and heat that even Southeast Asian visitors call "worse than home." 57% of foreign visitors reported heat illness symptoms in summer. | "まじで日本の夏は暑すぎる" — "Japan's summer is seriously too hot." Japanese people themselves warn visitors away from July–August. |
The one thing to remember: The "best" month isn't when the scenery peaks — it's when great weather, low crowds, and genuine local welcome overlap. That window is narrower than you think, and this article will show you exactly where it is.
About the Data
📊 Government statistics — Visitor numbers are from JNTO's Monthly Visitor Statistics 2025, covering all 42.7 million arrivals by nationality and month. Accommodation data is from the Japan Tourism Agency's Accommodation Survey 2025 (Confirmed/確定値), with monthly occupancy rates for all 47 prefectures. Excel data. Climate data uses JMA 30-year normals (1991–2020) for six major cities.
💬 Japanese voices — 286 Japanese-language responses collected from public platforms across five topics related to tourism timing. Not a scientific survey — a collection of what real Japanese people said in their own words about when they want visitors to come.
Part 1: The Numbers
All temperatures are in Celsius. For reference: 20°C = 68°F, 30°C = 86°F, 0°C = 32°F.
42.7 Million Visitors — But Not Evenly Spread
In 2025, Japan welcomed a record 42.7 million visitors. But they didn't arrive evenly. Here's how 12 months actually looked:
| Month | Visitors | vs. Average | Hotel Occupancy | Foreign Stays |
|---|---|---|---|---|
| Jan | 3,781,629 | +6.3% | 54.6% | 15.2M nights |
| Feb | 3,258,491 | −8.4% | 60.4% | 13.8M nights |
| Mar | 3,497,755 | −1.6% | 61.1% | 14.9M nights |
| Apr | 3,909,128 | +9.9% 🔺 | 61.4% | 17.2M nights 🔺 |
| May | 3,693,587 | +3.9% | 61.7% | 15.9M nights |
| Jun | 3,377,985 | −5.0% | 58.8% | 14.2M nights |
| Jul | 3,437,118 | −3.3% | 61.2% | 14.2M nights |
| Aug | 3,428,406 | −3.6% | 65.7% | 14.1M nights |
| Sep | 3,267,228 | −8.1% | 62.8% | 12.8M nights 🔻 |
| Oct | 3,896,524 | +9.5% | 66.6% 🔺 | 16.9M nights |
| Nov | 3,518,195 | −1.0% | 65.4% | 14.8M nights |
| Dec | 3,617,791 | +1.7% | 59.5% | 15.8M nights |
Two things jump out. First, the gap between the busiest and quietest months is smaller than you'd expect — only 642,000 visitors separate April's peak from February's trough. Japan no longer has a true "off-season." Second, October has the highest hotel occupancy (66.6%) even though April has the most visitors. That's because October visitors stay longer, booking more nights per trip — a pattern that also shows up in how tourists distribute their spending.
But national averages hide dramatic regional differences.
The City-by-City Story
Where you go matters as much as when you go. Here's how hotel occupancy varies across Japan's most popular destinations:
| Month | Tokyo | Osaka | Kyoto | Hokkaido | Okinawa | Fukuoka |
|---|---|---|---|---|---|---|
| Jan | 71.1% | 71.6% | 52.8% 🔻 | 62.1% | 52.5% | 67.8% |
| Feb | 75.4% | 76.2% | 56.1% | 68.0% | 62.1% | 74.9% |
| Mar | 76.3% | 76.8% | 66.7% | 55.2% | 59.6% | 72.4% |
| Apr | 79.4% | 81.0% | 73.9% | 46.3% 🔻 | 60.5% | 73.8% |
| May | 77.5% | 82.0% | 71.3% | 55.1% | 56.2% | 72.9% |
| Jun | 73.2% | 79.4% | 66.1% | 64.7% | 58.8% | 68.5% |
| Jul | 73.5% | 74.9% | 61.9% | 69.8% 🔺 | 64.4% | 68.8% |
| Aug | 74.5% | 80.7% | 63.9% | 69.5% | 66.4% 🔺 | 71.2% |
| Sep | 76.5% | 83.4% | 70.1% | 67.4% | 62.6% | 69.9% |
| Oct | 80.6% 🔺 | 84.9% 🔺 | 76.8% 🔺 | 63.2% | 66.6% | 76.3% |
| Nov | 79.8% | 79.0% | 74.3% | 54.2% | 61.3% | 77.8% 🔺 |
| Dec | 78.2% | 72.9% | 67.0% | 59.5% | 51.9% 🔻 | 71.1% |
Kyoto tells the most dramatic story. January occupancy is 52.8% — nearly half the rooms sit empty. By October, it's 76.8%. That's a 24.0 percentage point swing, the widest of any major destination. If you've heard "Kyoto is always packed," the data says otherwise — Kyoto in January is a different city.
Hokkaido runs on the opposite calendar. April has the lowest occupancy (46.3%) — spring hasn't arrived yet while mainland Japan celebrates cherry blossoms. Peak is July (69.8%) when the rest of Japan is sweltering. Even Mount Fuji follows seasonal logic — its daily climbing cap means timing your visit matters more than ever.
Osaka is the hardest city to find a room. It hits 85% in October and stays above 75% for eight months. If Osaka is your primary destination, February and December are your best windows.
Okinawa is most available in winter (51.2% in December, 51.7% in January) when the mainland is freezing but Naha still averages 17–19°C.
Where Your Country Fits
Not all visitors follow the same calendar. Your nationality might be working for — or against — you:
| Market | Peak Month | Trough Month | Concentration Ratio | Pattern |
|---|---|---|---|---|
| 🇰🇷 South Korea | Dec (974K) | Aug (661K) | 1.5x | Winter lovers — ski season, affordability |
| 🇨🇳 China | Aug (1,019K) | Dec (330K) | 3.1x | Summer surge — school holidays drive timing |
| 🇹🇼 Taiwan | Jul (604K) | Feb (507K) | 1.2x | Steady visitors — most evenly spread |
| 🇺🇸 USA | Jun (345K) | Jan (183K) | 1.9x | Summer + shoulder — peaks June, strong spring/autumn |
| 🇪🇺 Europe | Apr (405K) | Jan (113K) | 3.6x | Extreme spring/autumn — almost nobody comes in winter |
| 🇦🇺 Australia | Jan (140K) | Aug (41K) | 3.4x | Southern hemisphere flip — their summer = Japan's winter |
| 🇹🇭 Thailand | Dec (174K) | Jul (49K) | 3.6x | Avoiding heat — skip Japan's summer entirely |
| 🇸🇬 Singapore | Dec (141K) | Jul (24K) | 5.9x | Most concentrated — almost exclusively winter visits |
European visitors show the most extreme concentration: 3.6 times more visitors in April than January. This means if you're European and you visit in winter, you're going against the grain of your own market — and you'll find dramatically fewer compatriots competing for the same ryokan, restaurants, and temple experiences.
Taiwanese visitors are the most evenly distributed — no month is dramatically busier than another. This partly explains why Japanese businesses in tourism-heavy areas report consistently positive experiences with Taiwanese visitors: the steady flow prevents the "wave" effect that strains local resources.
The Weather Layer
Numbers don't matter if you're miserable. Here's what the climate actually looks like across Japan:
| Month | Tokyo | Osaka | Sapporo | Naha | Best For |
|---|---|---|---|---|---|
| Jan | 5.4°C ☀️ | 6.2°C ☀️ | −3.2°C ❄️ | 17.3°C 🌤️ | Okinawa escape, Hokkaido snow |
| Feb | 6.1°C ☀️ | 6.6°C ☀️ | −2.7°C ❄️ | 17.5°C 🌤️ | Sapporo Snow Festival, empty Kyoto |
| Mar | 9.4°C 🌸 | 9.9°C 🌸 | 1.1°C ❄️ | 19.1°C 🌤️ | Early cherry blossoms (south) |
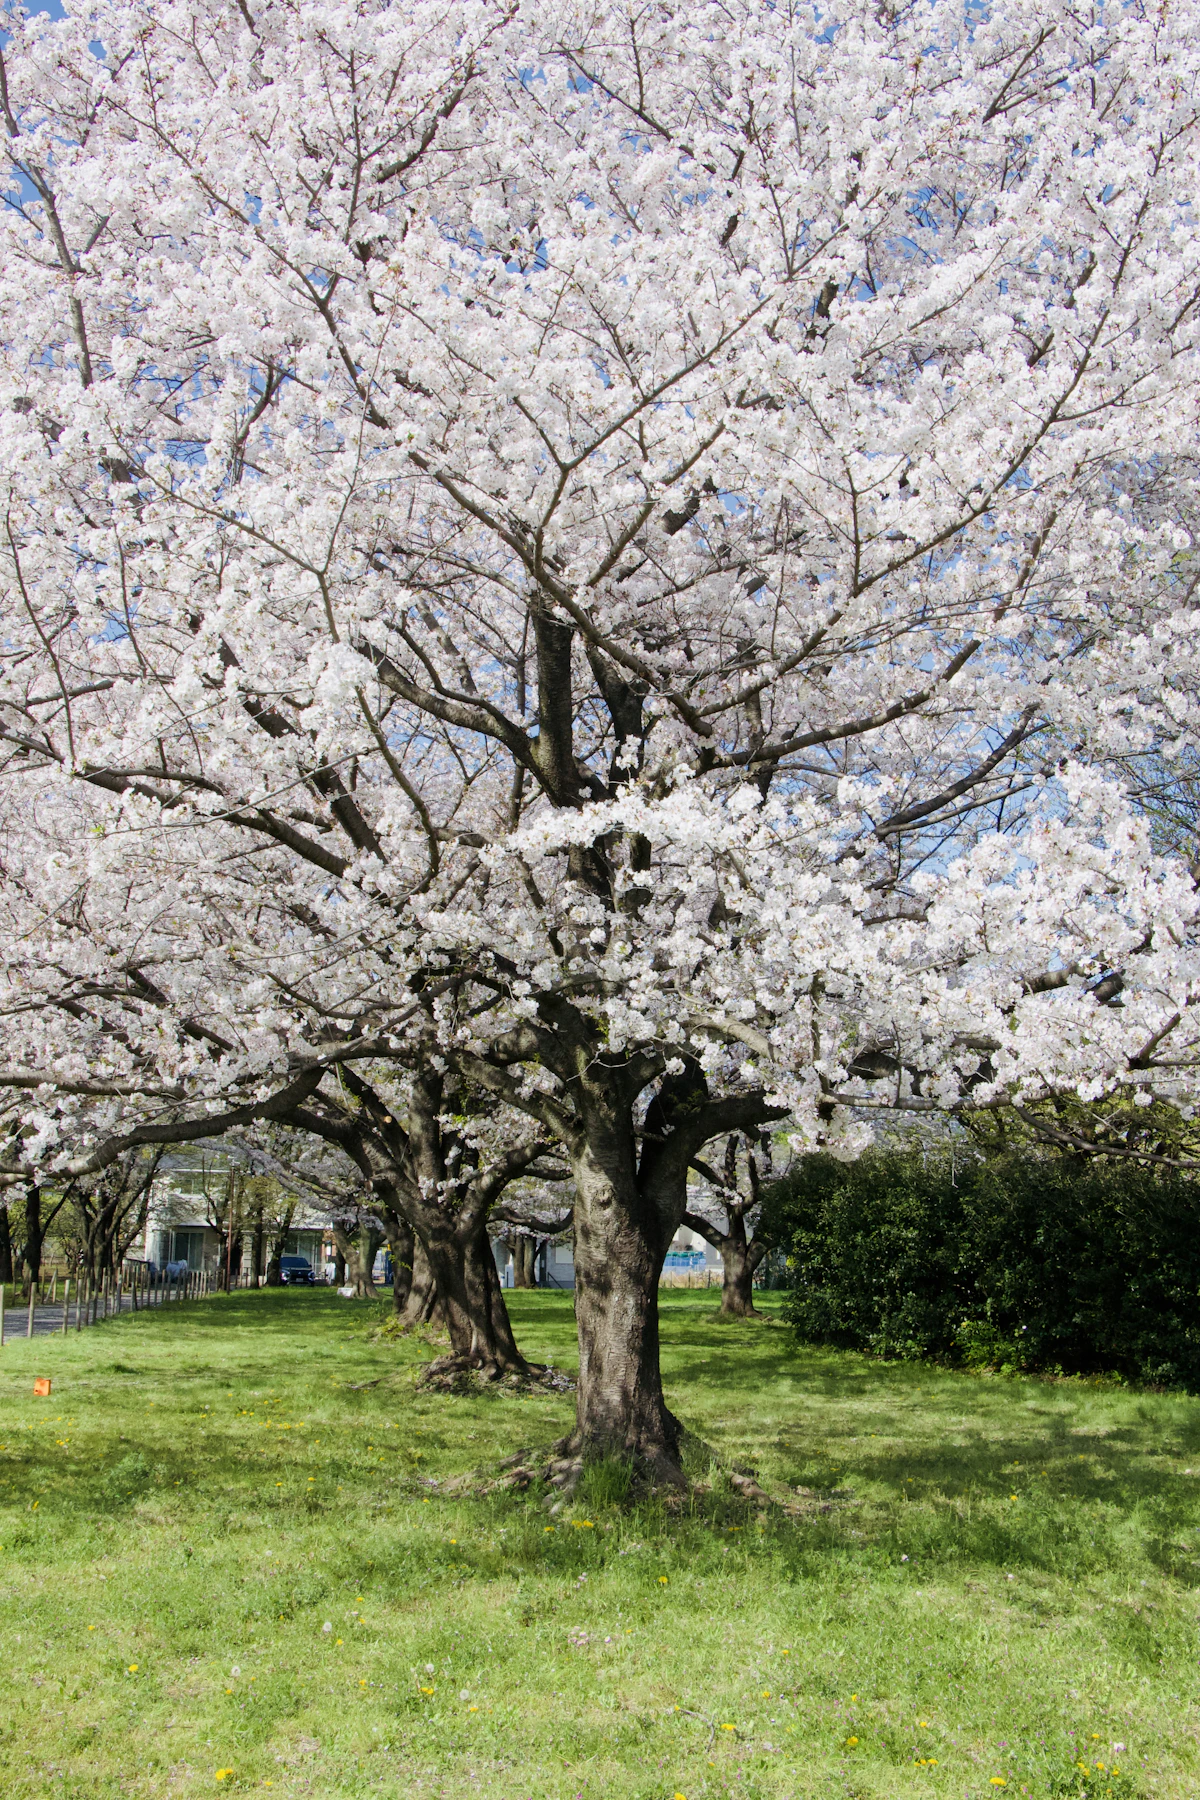
| Apr | 14.3°C 🌸 | 15.2°C 🌸 | 7.3°C 🌤️ | 21.5°C ☀️ | Peak cherry blossom, peak crowds |
| May | 18.8°C ☀️ | 20.1°C ☀️ | 13.0°C ☀️ | 24.2°C 🌧️ | Golden Week ends, crowds ease |
| Jun | 21.9°C 🌧️ | 23.6°C 🌧️ | 17.0°C ☀️ | 27.2°C 🌧️ | Hokkaido only (no rainy season) |
| Jul | 25.7°C 🌧️ | 27.7°C ☀️ | 21.1°C ☀️ | 29.1°C ☀️ | Hokkaido summer, festivals |
| Aug | 26.9°C ☀️ | 29.0°C ☀️ | 22.3°C ☀️ | 29.0°C ☀️ | Extreme heat, Obon domestic rush |
| Sep | 23.3°C 🌧️ | 25.2°C 🌧️ | 18.6°C 🌧️ | 27.9°C 🌧️ | Typhoon season, still hot |
| Oct | 18.0°C 🍂 | 19.5°C 🍂 | 12.1°C 🍂 | 25.5°C ☀️ | Peak foliage, peak occupancy |
| Nov | 12.5°C 🍂 | 13.8°C 🍂 | 5.2°C ❄️ | 22.5°C ☀️ | Late foliage, crowds easing |
| Dec | 7.7°C ☀️ | 8.7°C ☀️ | −0.9°C ❄️ | 19.0°C 🌤️ | Illuminations, year-end atmosphere |
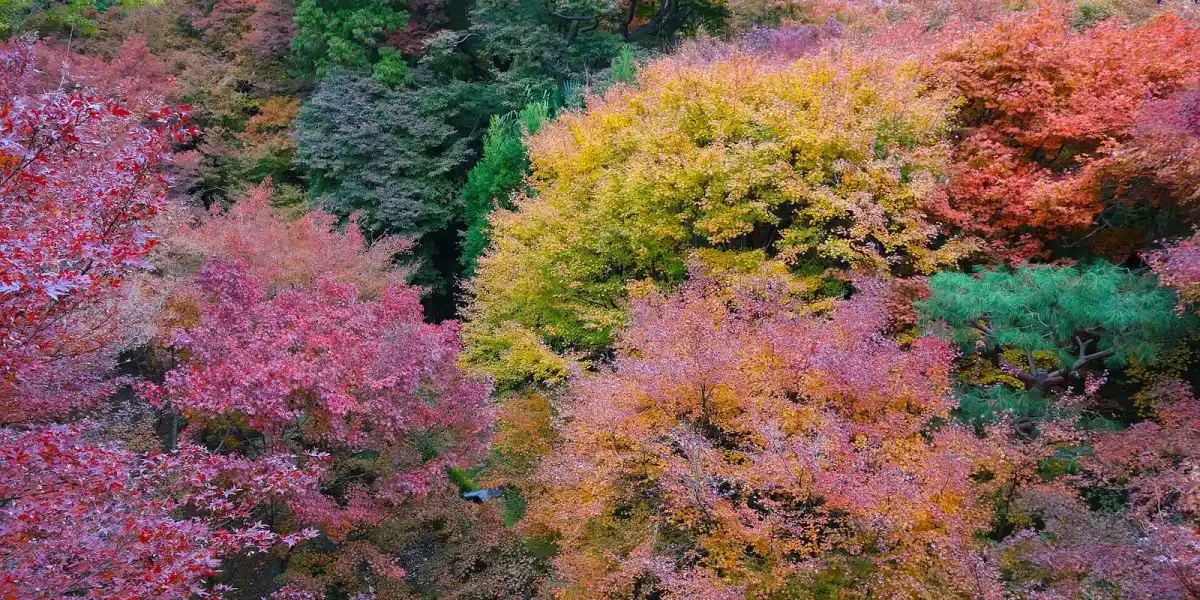
The weather tells a clear story: mainland Japan has two ideal windows (mid-March to mid-May, and mid-October to late November) sandwiching a brutal summer. But Hokkaido and Okinawa run on different clocks — Hokkaido's best weather arrives when the mainland is drowning in rain, and Okinawa stays warm when everywhere else is freezing. Landscapes follow their own clocks too: the vast grasslands around Mount Aso turn fresh green in summer and ripple gold with pampas grass in autumn, when the clearest mornings bring a sea of clouds across the crater.
Tokyo receives more rain in October (235mm) than in any summer month — a fact that surprises most visitors planning an "autumn trip." September is the wettest month nearly everywhere. If rain is your enemy, November and February are your safest bets on the mainland. And foliage keeps its own calendar by altitude: in the mountains around Nikko, north of Tokyo, the colors turn weeks earlier up high than down among the shrines — so an autumn trip there is really several timings at once.
Part 2: What the Numbers Don't Tell You
The data above tells you when it's crowded and where it's available. It doesn't tell you what the Kyoto shopkeeper feels when her street empties in January, or why a rural inn owner says "thank you for choosing us over Tokyo," or how Japanese people honestly feel when 3.9 million visitors arrive in a single month.
That's where 286 Japanese voices come in — and where the numbers start to mean something.
🟢 "Come When It's Quiet — We'll Be Glad to See You"
The clearest signal in all 286 responses: Japanese people overwhelmingly welcome off-peak visitors.
Of 60 responses about how Japanese people feel when tourists visit during quiet months:
75% positive — the highest welcome rate across any viewpoint we've measured on this site. For context, our research on general tourist feelings found positive rates closer to 30%. The timing makes a difference.
A Kyoto resident described January:
京都。1月は本当に観光客が少ないのでおすすめ。西欧系の人はクリスマスが大事なので国に帰ってるし、日本の人は年末年始が最後で1月3日を境に一気に来なくなる Kyoto. January has genuinely few tourists — I recommend it. Western visitors go home for Christmas, and Japanese visitors disappear after January 3rd.
Another visitor to off-season Kyoto:
人いなさ過ぎて不安になったぐらいだった It was so empty, I actually got worried.
むかし暮らしていた頃のような穏やかな空気感でえがった It felt like the calm Kyoto I used to live in. Lovely.
A local business owner put it simply:
この人ら来てくれんと、つぶれるし、ありがたい If these people didn't come, we'd go under. We're grateful.
The warmth extends beyond Kyoto. Residents of rural destinations — Yamaguchi, Aomori, Tohoku — actively invite visitors. A taxi driver reported that more foreign tourists are heading to San'in and Tohoku after "finishing" Kyoto. These quieter regions don't experience overcrowding — they experience undercrowding. Aomori's Hirosaki Castle, the only original castle keep left standing in the north, catches the cherry blossom in late April — weeks after the big cities have turned green — and stays calm outside its short festival. For them, every visitor in January or February represents survival. And getting around Japan is easier than most visitors expect — even to these off-the-beaten-path destinations. If you want to understand exactly where your welcome will be warmest before you book, Japan's regional welcome map breaks down the welcome dynamics prefecture by prefecture, giving you the data to choose not just the right season but the right place.
And there's a quality dimension that the data doesn't capture but the voices do:
「郷に入れば郷に従え」ができる客層が、閑散期に来る The kind of visitors who "follow local customs when in a new place" tend to come during quiet seasons.
Multiple Japanese people we asked observed that off-peak visitors tend to be more culturally aware, more respectful, and more engaged with local customs — the kind who try a few words of Japanese or bow instinctively when saying thank you. Whether that's cause or effect — people who research deeper find quieter months, or quieter months bring out more considerate behavior — the result is the same: the welcome is warmer when the crowds are thinner.
Here's where the data and the voices tell the same story. The JNTO data shows February has 650,000 fewer visitors than April. The accommodation data shows Kyoto has 23.6 percentage points less occupancy in January than October. And the voices say, overwhelmingly: "we notice when you come during the quiet months, and we appreciate it." The numbers create the space. The welcome fills it.
💡 The timing premium
Off-peak visitors don't just get lower prices and shorter lines. They get a fundamentally different reception. 75% welcome rate vs. roughly 30% during peak season isn't a small difference — it's the gap between being part of a crowd and being a guest.
🟡 "We Love That You Want to See the Cherry Blossoms — But..."
Spring and autumn are beautiful. They're also when Japanese people feel most exhausted by tourism.
Of 62 responses about spring/autumn tourist concentration:
The autumn foliage crowds hit hardest:
紅葉シーズンの清水寺、人口密度がとんでもないことになっててほぼ身動き取れなかった During autumn foliage season at Kiyomizu Temple, the crowd density was unbelievable — you could barely move.
京都には観光シーズンなんてないわな。1年中人が途切れることなくなったから There's no such thing as a "tourist season" in Kyoto anymore. The crowds never stop, all year round.
If autumn is your season, it's worth knowing how Japanese people really feel about those crowds — and the gentle ways they still enjoy the colors: Autumn Leaves in Japan.
Kyoto's efforts to distribute tourists across seasons may have backfired:
京都は必死に観光客が来る時期を分散させました。その結果、観光シーズンが無くなって、年中混み合うようになった Kyoto worked hard to spread tourists across seasons. The result? The "tourist season" disappeared — now it's crowded year-round.
And the displacement of Japanese residents themselves:
10年前はまだそこまで人いなかったし、京都に住んでた学生の時にもっと観光したりいろいろしておけばよかったな Ten years ago it wasn't this bad. I wish I'd explored more when I was a student living in Kyoto.
But here's what makes this nuanced, not simply negative. Several voices offered pragmatic acceptance:
観光って日本最後の競争力かもしれないからね Tourism might be Japan's last competitive advantage.
外国人観光客のマナー、日本人の花見客より良いかもしれない Foreign tourists' manners might actually be better than Japanese cherry blossom party groups.
The data confirms what the voices describe. April's 3.9 million visitors create a concentration ratio of 1.2x versus the annual average — not extreme on paper, but when combined with domestic travelers (total overnight stays hit 53 million in April), the pressure is real. In Kyoto specifically, the swing from 52.6% occupancy in January to 75.1% in April means the city absorbs nearly 50% more overnight guests in its busiest month.
But here's the integration insight: the frustration creates the opportunity. The same people who say "Kyoto is unbearable in October" also say "come in January, we'd love to see you." The 55% negative sentiment about peak season and the 75% positive sentiment about off-peak aren't contradictions — they're two sides of the same coin.
💡 The invitation hidden in the complaint
When Japanese people say "there are too many tourists in April," they're not saying "don't come." They're saying "come — but maybe not then." The data backs this up: shifting from April to February cuts crowds by 650,000 visitors, drops Kyoto's occupancy by 20 percentage points, and transforms the local welcome from strained to genuinely warm.
🔴 Summer: The Honest Warning
Japanese people aren't being dramatic when they tell you to avoid summer. The data supports their concern.
Of 52 responses about summer tourism:
The warnings are vivid:
まじで日本の夏は暑すぎるので外国人のみなさんは10月くらいまで来ない方がいい気がする Seriously, Japan's summer is way too hot. I feel like foreigners should just not come until October.
日本人でも湿気と雨、そして頭痛で嫌になります Even Japanese people can't stand the humidity, rain, and headaches.
This isn't exaggeration. According to a Japan Weather Association survey (2020, n=200) and municipal heat-stroke prevention campaigns, 57% of foreign visitors reported heat illness symptoms during summer visits, and 89% found Tokyo's summer muggy — including 99% of North Americans. Even visitors from tropical countries weren't prepared:
60%の熱帯地域からの訪問者が「日本の夏は母国より辛い」と回答 60% of visitors from tropical regions said Japan's summer is harder than home.
The humidity is the differentiator. Tokyo in August averages 29°C — similar to Singapore or Bangkok — but with 74% humidity and concrete heat islands that push perceived temperature well above 35°C. It's not the heat, it's the wet heat.
But summer has a paradox worth understanding. August's 65.9% hotel occupancy is the highest nationally — yet it's driven almost entirely by domestic travel. Japanese families flood resort areas during Obon (mid-August). Meanwhile, foreign visitor overnight stays actually drop to 13.8 million in August — among the lowest all year.
This creates a hidden opportunity:
お盆は逆に有名観光地が空く。日本人が実家に帰省するから Obon actually empties out famous tourist spots — because Japanese people go to their family homes.
And the cultural trade-off that 40% of voices acknowledged:
花火大会の経験は85.4%の外国人が「日本の夏ベスト体験」に選んだ In a survey of foreign residents, 85.4% chose fireworks festivals as their number-one summer experience.
So summer isn't a blanket "don't go." It's a "know what you're signing up for" situation. The data suggests two viable summer strategies: Hokkaido (no rainy season, 17–22°C, peak flower fields) or targeting Obon week in non-resort cities where domestic tourists have cleared out.
💡 The Hokkaido exception
While mainland Japan suffocates in June-August, Hokkaido skips the rainy season entirely and stays 10°C cooler. Its accommodation occupancy peaks in July (70.7%) but that's still lower than Tokyo or Osaka on an average month. If summer is your only option, redirect north — to a city like Hakodate, where summers stay cool even when Honshu swelters and the cherry trees don't open until around the start of May, weeks after the rest of Japan.
💬 What do you think?
Japanese readers: How do you feel about this?Visitors: Have you experienced this in Japan?
Share your voice →The Rainy Season: A Surprisingly Beautiful Exception
One finding we didn't expect: Japanese people have genuinely warm things to say about rain.
Of 60 responses about visiting during the rainy season (梅雨, mid-June to mid-July):
The warnings are practical:
せっかく観光に行くのに梅雨シーズンで雨でまともに観光できないのが勿体無い It feels like a waste to go sightseeing during rainy season and not be able to do it properly.
But the counterpoint was unexpectedly poetic:
しっとりとした空気が心を落ち着かせてくれる The moist air has a way of calming the soul.
Multiple voices described a Japan that only appears in the rain:
雨の鎌倉は紫陽花が本当に美しい Kamakura in the rain, with hydrangeas in bloom, is truly gorgeous.
苔が緑に光る The moss glows green.
Those rain-soaked hydrangeas are a season of their own: Japan's ajisai glow their deepest blues and pinks in exactly this rain, and locals say the wet weather is the whole point.
These same early-summer evenings, from late May into early July, are also when Japan's fireflies come out over the streams — a quiet, fleeting sight that Japanese people gather to watch in the dark and, tellingly, never catch.
The data supports trying rainy season if you can handle the dampness. June has the 5th-fewest visitors (3.38 million), Kyoto drops to 66.2% occupancy, and prices fall. The practical downsides are real — high humidity (75%+), unpredictable rainfall, limited outdoor activities. But the visual rewards and dramatically lower competition make it a legitimate option for flexible travelers.
And remember: Hokkaido has no rainy season. June in Sapporo averages 17°C, 60mm of rain (vs. 168mm in Tokyo), and 180 hours of sunshine. It's arguably Hokkaido's most pleasant month.
The Generation Gap
Our research across 52 voices revealed nuanced generational differences in how Japanese people feel about tourist timing:
Younger generations (10s–20s) are more likely to see tourism as cultural exchange (22.1% vs. 11.9% overall) and less likely to express frustration. They grew up with foreign tourists as a normal part of the landscape.
Older generations (60s+) take the most direct action — both positive and negative. They're the ones who physically guide lost tourists to their destinations, but also the ones most likely to call for visitor caps or express nostalgia for a quieter Japan.
Middle generations (30s–40s) focus on infrastructure: overcrowded buses, inability to get restaurant reservations, rising prices. Their frustration is practical, not cultural.
One cross-generational finding stood out: 65% cited manners as their primary concern, with no significant age gap. The stereotype that "older Japanese are less tolerant" doesn't hold — all generations care about the same thing, and it isn't when you come. It's how you behave while you're here.
Where the Data and Voices Agree: The Real Best Times
Three layers of data. 286 voices. Here's where everything converges:
| Window | Weather | Crowds | Local Welcome | The Catch |
|---|---|---|---|---|
| 🥇 Mid-Jan to Feb (excluding CNY week) | Cold but dry. Okinawa 17°C. Snow festivals in Hokkaido. | Lowest (3.26M visitors). Kyoto 52–55% occupancy. | Highest (75% positive). Locals genuinely grateful. | It's cold. "Cold enough to think it's trying to kill you," as one voice put it. |
| 🥈 Late November | Perfect autumn. 12–14°C on mainland. Last foliage. | Below peak (3.52M). Kyoto 74.3% (vs. Oct's 76.2%). | High. The easing from October peak is palpable. | Foliage is ending, not peaking. Some trees already bare. |
| 🥉 June in Hokkaido | 17°C, no rainy season, lavender fields begin. | Low nationally. Hokkaido 64.5%. | Moderate-to-high. Rural Hokkaido actively welcomes visitors. | Rest of Japan is in rainy season. Hokkaido-only trip. |
| Honorable mention: Early December | 7–9°C, dry. Illuminations begin. | Below average (3.62M). Osaka drops to 73%. | Moderate. Holiday warmth in the air. | Short daylight hours. Not yet festive until mid-December. |
The window most visitors miss: February outside of Chinese New Year week. European visitors are almost entirely absent (113,000 in January vs. 405,000 in April). The weather is dry and clear — Tokyo gets only 57mm of rain, fewer than any other month. It's also when the plum blossoms that open before the cherries come into their own — late January through early March, weeks ahead of sakura. Kyoto runs its special "Winter Journey" program, opening normally closed temple interiors. February is also when the deep snow lies heaviest up north, when a snow-country hot-spring town like Ginzan Onsen — gas lamps glowing over snow-banked wooden inns — looks most like the Japan of old postcards. And the welcome? The warmest you'll find anywhere in Japan, any time of year.
The popular choice that still works: If cherry blossoms or autumn foliage are non-negotiable, the data suggests early April (before peak week) or late October into early November (the tail of peak). Even a week's shift can mean the difference between 85% and 75% hotel occupancy in Osaka. And the bloom itself buys you time: on the sacred cherry mountain of Yoshino, the blossoms climb the slopes by altitude over weeks, so a single trip can catch them at different stages.
One More Thing
Every travel guide frames this question as "when is the best weather?" or "when are the cherry blossoms?" This article tried to answer a different question: when does Japan most want you there?
The answer isn't complicated. Come when it's quiet. Explore beyond the obvious. Stay a little longer. And if you do visit during peak season — no judgment. The cherry blossoms really are that beautiful.
But know this: the Japanese person serving your coffee in February, or the ryokan owner welcoming you to an almost-empty guesthouse in January, or the shopkeeper in Tohoku who can't believe you chose her town over Tokyo — they notice. And they're grateful.
That's not something the guidebooks can tell you. But the data — and the voices — can.
Sources
Statistical Data (Primary Sources — directly analyzed)
All statistical data was extracted directly from the following government files, downloaded and stored in the article's sources/ directory. See sources/README.md for detailed extraction notes and sheet references.
JNTO: Monthly Visitor Statistics 2003–2026
- Published: Updated monthly (latest: 2026-04-15)
- Excel tables (
jnto_visitors_2003_2026.xlsx):- Sheet "2025": Nationality/monthly visitor numbers for 2025 (all figures provisional)
- Sheet "2026": January–March 2026 data
- Downloaded from: https://www.jnto.go.jp/statistics/data/visitors-statistics/
Japan Tourism Agency: Accommodation Survey 2025 (Confirmed/確定値)
- Published: 2026-07-06
- Excel tables (
accommodation_2025_annual_confirmed.xlsx, stored in the42-million-visitorscompanion article'ssources/directory):- Tables 2 (monthly): Total and foreign overnight stays by prefecture
- Tables 8 (monthly): Room occupancy rates by prefecture
- Tables 2/8 (annual): Year totals
- Downloaded from: https://www.mlit.go.jp/kankocho/tokei_hakusyo/shukuhakutokei.html
Japan Meteorological Agency: Climate Normals 1991–2020
- 30-year statistical averages for monthly temperature, precipitation, and sunshine hours
- Stations used: Tokyo (47662), Osaka (47772), Kyoto (47759), Sapporo (47412), Naha (47936), Fukuoka (47807)
- Accessed at: https://www.data.jma.go.jp/stats/etrn/index.php
Japanese Voices
- 62 responses on spring/autumn tourist concentration
- 60 responses on off-peak visitor welcome
- 60 responses on rainy season experiences
- 52 responses on summer tourism
- 52 responses on generational attitudes
Collected from public Japanese Q&A sites, forums, and social posts, along with LIVE JAPAN, travel media, news comments, and other public Japanese-language sources.
Note on Quotations
Quotes from online platforms have been lightly edited for readability (fixing typos, formatting for clarity). The meaning and intent of each comment remain unchanged. Original sources are linked in the research data files.
Data Notice
JNTO visitor statistics for 2025 are provisional (暫定値) — JNTO's own confirmed figures follow later in the year. Japan Tourism Agency accommodation data for 2025 was updated to the confirmed (確定値) release published 2026-07-06; occupancy rates and foreign guest-nights shifted by less than 1.5 percentage points from the preliminary figures across all months and cities shown here. Climate normals are confirmed 30-year averages.
How well do you know Japan?
Based on 31,517+ real Japanese voices
Want to know more? Ask Japanese people
Have a follow-up question about this topic? We'll ask real Japanese people.
Voice Box →